|
Reports of participation in previous years 2004/2005 Academic Year The Club has been functioning since the 2004/2005 academic year, the evolution and participation of students and tutors-students (F1) being as follows:
A reduction of students’ attendance is appreciated during the third term, either because their objectives had already been achieved in the previous terms or due to the Easter Holidays or to the proximity of the end of the academic year. 2005/2006 Academic Year The attendance data for the 2005/2006 academic year are given below:
An average attendance of more than 8 students per session is maintained during this academic year, the increase being close to 50 %. The number of sessions has grown because the academic year started earlier than the year before, and attendance also shows a considerable increase. 2006/2007 Academic Year These are the statistical data corresponding to the 2006/2007 academic year:
Attendance grows significantly, above all during the first term, with an average of 17 students per session and a 55% increase of attendance throughout the year. Attendance during the previous years is shown in the following graph: 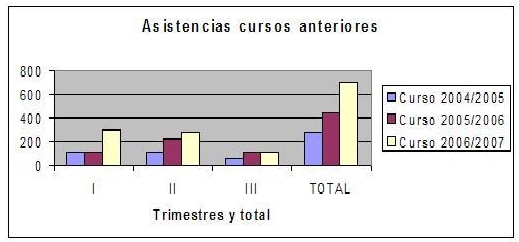 2007/08 Academic Year These are the statistical data corresponding to the 2007/2008 academic year:
2008/09 Academic Year These are the statistical data corresponding to the 2008/2009 academic year:
2009/10 Academic Year These are the statistical data corresponding to the 2009/2010 academic year:
|
|||||||||||||||||||||||||||||||||||||||||||||||||||||||||||||||||||||||||||||||||||||||||||||||||||||||||||||||||||||||||||||||||||||||||||||||||||||||||||||||||||||||||||||||